Of Shopping by Gender and Chopping with Blenders
Statista suggested that the following seven categories were those which people purchased the most online items from:
- Fashion. clothing, and accessories
- Health and beauty
- Toys and baby supplies
- Books, CDs, and other physical media
- Groceries, food, and drink
- Technology (including smartphones and computers)
- Home and furniture
- Flowers and gifts
Seems odd to me that food and drink would come in as 5th, no? I guess a lot of people look up food online so they can try out the recipe — when they’re felling like skipping the traffic, wait lines, somewhat optional yet delayed car repairs, babysitter, expired safety and emission stickers (yours truly has been in this situation many, many times) — and when they might want to make a recipe that is Lactose free, Gluten free, Sucrose free, sugar-free, substitute apple sauce for butter in cookie recipes, or in other words make the delicious dish of food more personalized, healthy, and quickly (no waiting for the delivery guy to get through rush hour traffic when you make the recipe at home).


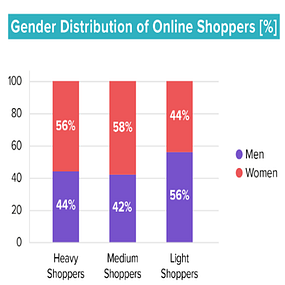
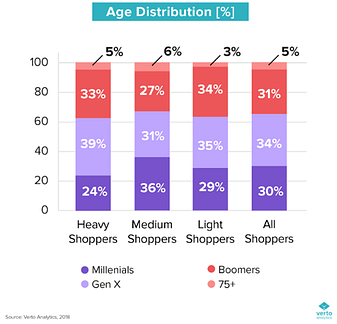
Verto Analytics provided the chart above and below. Interesting how the gender switches as the amount of shopping varies from Heavy to Medium to Light.

This chart I’m a little hesitant to put too much weight in as unemployment trends influence spending habits, online and offline, IRL and URL.
So let’s run a little test ourselves, okay? Do any of the above charts apply to you — like do you feel it’s accurate or not accurate? Why? What do you think of the blender below?
And, yeah. If over 28,000 reviews seems suspiciously high, you are correct. Google Review counts your one review for say a Magic Bullet blender and applies it to all the Magic Bullet blenders it populates it’s Google Shopping results with.
